A time-window range breakout for gold. One trade idea per day, a hard stop on every position.
- Net profit
- +59.3%
- Profit factor
- 1.26
- Max drawdown
- 8.1%
Simulated, Jan 2020 – Sep 2026
$129or rent from $39/month

A Bollinger-and-RSI mean-reversion grid that waits for stretched prices to snap back.
Historical simulation: NZDCAD H1, Oct 2019 to Sep 2026, 10,000 USD start. Not indicative of future results.
Overview
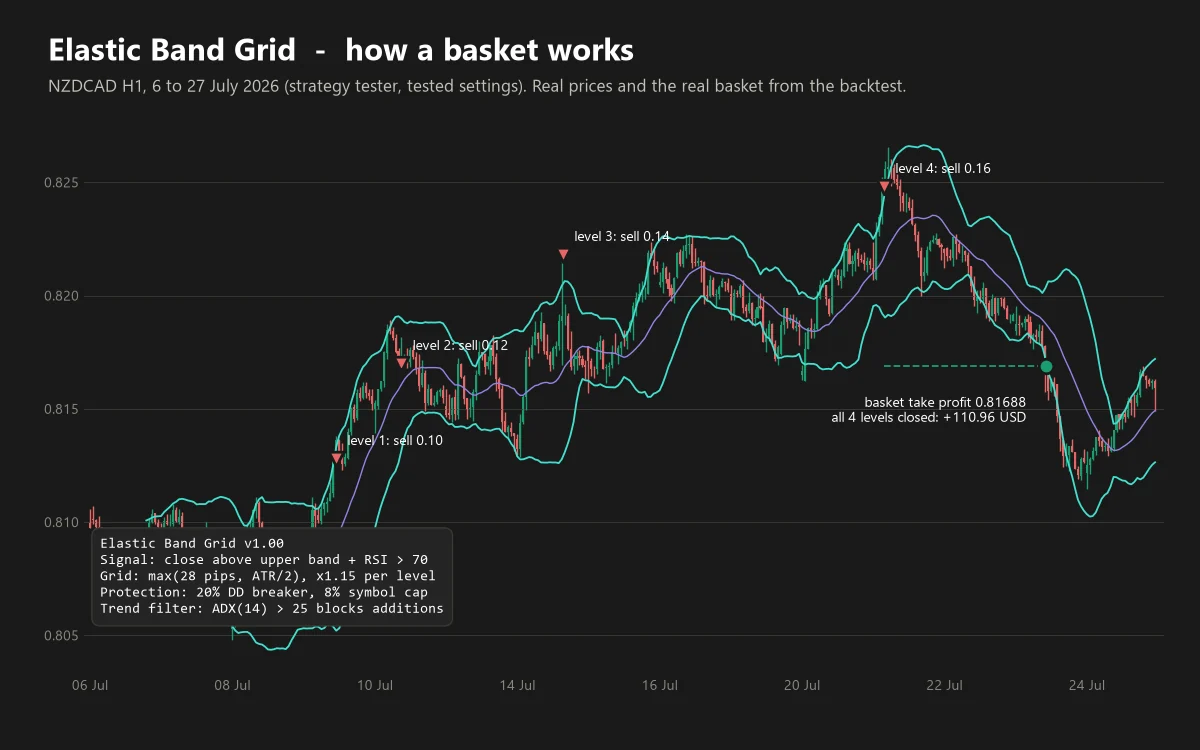
Elastic Band Grid buys stretched-down prices and sells stretched-up prices, adds a limited number of ATR-spaced levels if price keeps going, and closes the whole basket at one common take profit. A drawdown breaker, a per-symbol loss cap and a trend filter limit the damage when the market does not come back.
How it works
When the last closed bar closes below the lower Bollinger Band with RSI oversold, the EA buys. Above the upper band with RSI overbought, it sells.
If price keeps moving against the basket, a new level is added each time it moves the grid distance: the larger of a fixed minimum and half the ATR. Levels grow 1.15x, to a maximum of 6.
The whole basket shares a single take profit a fixed distance beyond its volume-weighted average price. When price returns, every level closes together.
A drawdown breaker, a per-symbol loss cap, a trend filter and a spread check step in when price does not return.
Features and protections
When equity falls a set percentage below balance (20% by default) the EA closes its trades or blocks new grids, as you choose.
If one symbol's basket loses more than a set share of balance (8% by default), only that basket is closed.
No new grid levels are added while a strong trend runs against the basket.
Limits how deep two related pairs (AUDCAD and NZDCAD by default) can be at the same time.
Uses the MetaTrader economic calendar around high-impact events (live trading only).
Enter a comma-separated symbol list to trade several pairs from a single chart. Broker suffixes are supported.
Backtest
Historical simulations from the MetaTrader 5 Strategy Tester. The test conditions are listed with each result so you can reproduce them.
| Year | Return |
|---|---|
| 2019* | +1.7% |
| 2020 | +15.7% |
| 2021 | +14.8% |
| 2022 | −4.0% |
| 2023 | +15.8% |
| 2024 | +12.2% |
| 2025 | +12.0% |
| 2026* | +4.9% |
| Year | Return |
|---|---|
| 2019 | +2.1% |
| 2020 | +6.2% |
| 2021 | +6.4% |
| 2022 | −14.1% |
| 2023 | +11.9% |
| 2024 | +5.0% |
| 2025 | +4.3% |
| 2026* | +6.6% |
Trading foreign exchange, metals and cryptocurrencies on margin carries a high level of risk and may not be suitable for everyone. Backtested and hypothetical results are not a guarantee of future performance. Read the full risk disclosure.
Requirements
Inputs
Symbols, magic base, maximum spread, slippage, minimum free margin; lot sizing method (Fixed, Low, Mid, High risk), fixed lot, maximum lots per trade.
Minimum distance, lot multiplier, maximum trades per grid, smart (ATR) distance; Bollinger period and deviation, RSI period and levels, grid take profit.
Maximum drawdown % and action, correlated-pair groups, news filter windows, per-symbol loss cap, ADX trend filter.
Set files and a PDF user guide are provided to buyers.
Questions
Because spread decides this strategy. The same settings were tested on raw-spread data and on wider-spread demo data, and we show both so you can judge a realistic range rather than the best case.
It can be. That is why the drawdown breaker, loss cap and trend filter exist, and why it is offered with a plain-language warning. It is not suitable for a strict prop-firm challenge.
Range-bound, low-spread crosses can work. Strongly trending pairs do not suit mean reversion. Backtest any pair yourself before using it.
Yes. The MQL5 Market demo runs in the Strategy Tester.
Also in the collection
A time-window range breakout for gold. One trade idea per day, a hard stop on every position.
Simulated, Jan 2020 – Sep 2026
The same disciplined box breakout, rebuilt for Bitcoin's volatility and its seven-day week.
Simulated, Jan 2020 – Sep 2026
Intraday momentum for the Nasdaq 100: it waits for price to leave its normal noise, then follows the move and is flat by the close.
Simulated, Jan 2023 – Oct 2026
Free guide · 24 pages
A free, plain-language introduction to algorithmic trading: what a trading robot actually is, how it makes decisions, and the steps from nothing to your first Expert Advisor running on a demo account.
Start with the free demo in the MetaTrader 5 Strategy Tester, on your own broker’s data, before you commit.